As a founder, building a startup feels like pushing a rock uphill. Frustrating, exhausting, relentless, uncertain.
If you don’t give up (and you get lucky), at some point you’ll finally start to show some signs of product-market fit. Great! It’s finally working.
At this point, you’re probably pretty tired, so it’s natural to want to rest from pushing the rock uphill, at least for a bit. You might now raise another venture round, based on the traction you’re seeing.
You’ll likely start to build out your team. You have something repeatable that you can scale with more people and, if you raise money, you also have the budget.
The new team members aren’t like the very early team members. The new folks are probably more professional, and more experienced. They have playbooks. They start to do what you ask them to do: turn the success you’ve found into a repeatable and predictable process to continue to scale revenue.
You have a working company that is growing. It should be celebrated.
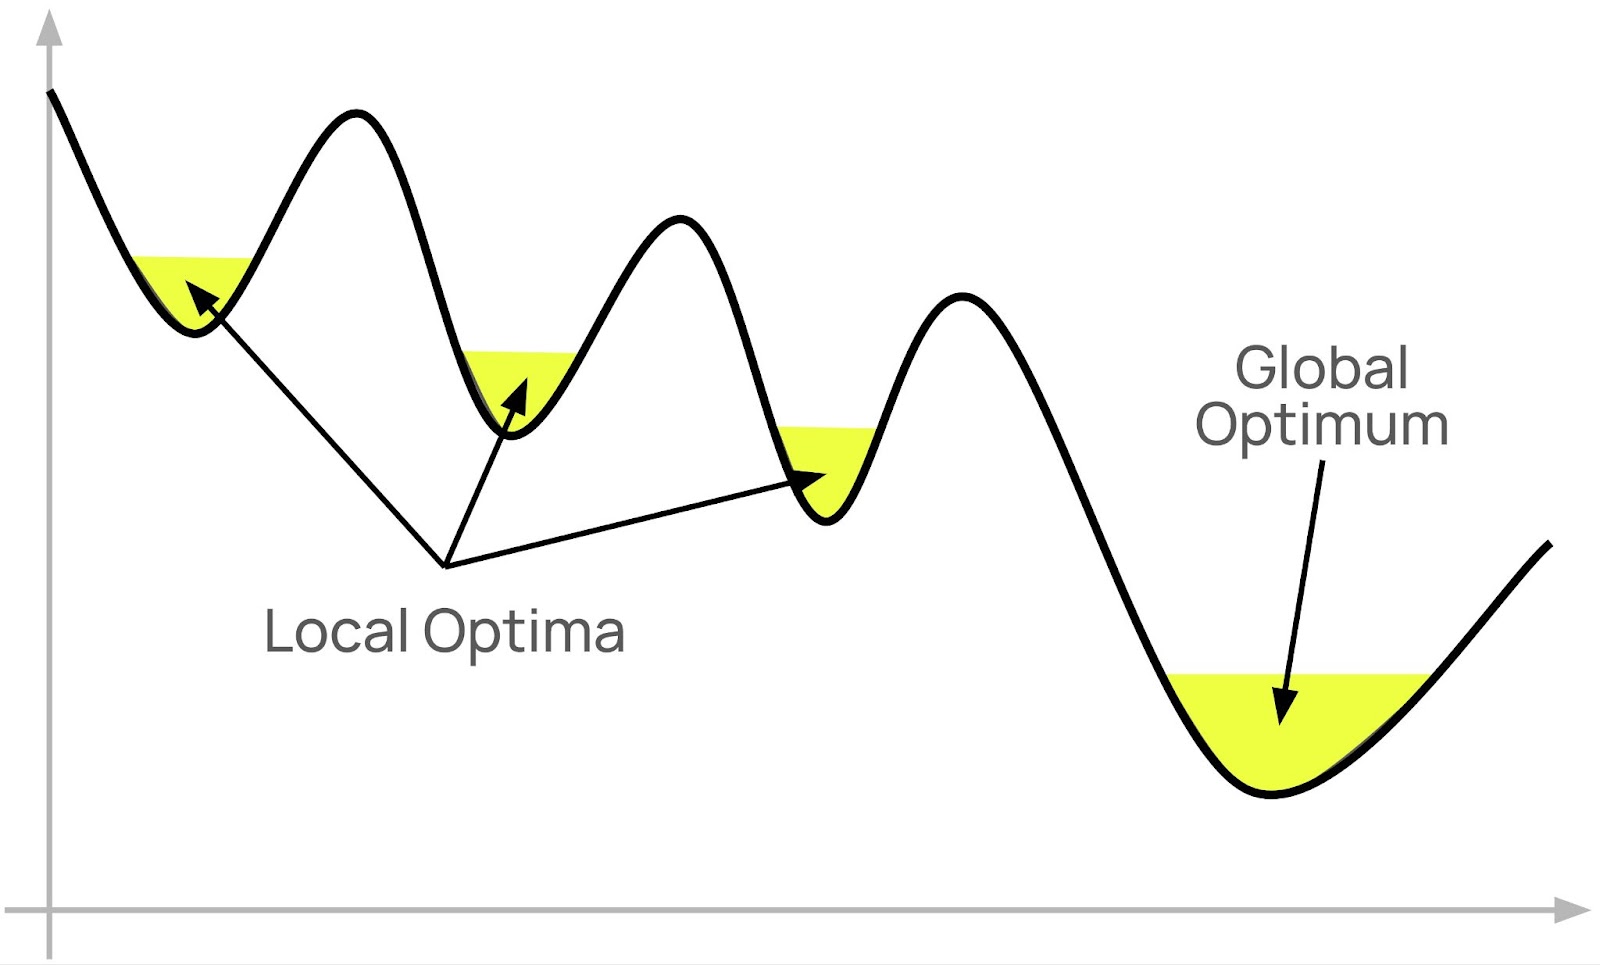
The problem is that you don’t know if you’ve found your global optimum or merely a local optimum.
Could there be an even better market, business model, product, and/or customer out there if you just keep looking; if you just keep pushing the rock uphill?
Many startups get stuck in these local optima. Why is it hard to escape them?
Firstly, everyone is telling you how important it is to focus. Do one thing well, rather than several things poorly. Great advice.
Secondly, you can unintentionally create the very inertia that keeps you stuck in the local optimum. All those people you hired once you got something working are there to maintain the local optimum: to make what’s working keep working. In fact, their jobs arguably depend on staying in the local optimum. So, they are unlikely advocates of trying something different.
There are also underlying cognitive biases at play here. Kahneman and Tversky wrote about “loss aversion” – the tendency to worry more about what you might lose from a change versus what you might gain. Others have written about “psychological inertia” and the “status quo bias”.
All of this happens against the backdrop of founders being bombarded with suggestions (many unsolicited) of things they might improve or do differently, competitors that are having success with a different model, new enablers that might be tried, etc.
I have some advice for both founders and investors on tackling this local vs global optimum challenge.
Founders:
Remain open to the idea that you may not yet have found the global optimum for your company, even when things seem to be going relatively well.
Reserve some mental bandwidth and resources for the ongoing pursuit of a global optimum. The whole point of a local optimum is that it takes initial effort to get out of it before you can continue to a better place. Conduct small experiments to explore options that may find better optima.
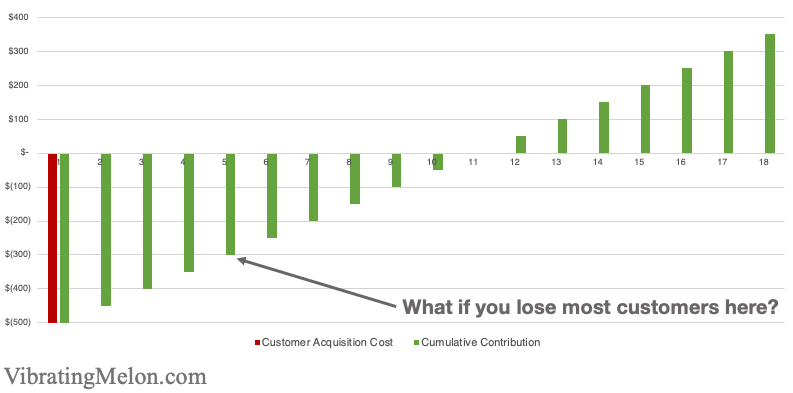
Be rigorously data-driven. To make sure you are comparing apples-to-apples, make sure you are comparing unit economics between options. I would argue that the Y-axis on the chart above should be CAC doubling time.
Investors:
Before sharing suggestions for other areas or models that a founder might explore, be clear on whether you think they genuinely present the opportunity to find a global optimum, versus just sharing to appear useful.
Be specific – explain why you’re sharing and describe how a change might get the founder to (or close to) the global optimum.
By the way, the seeking of global optima is precisely what the underlying algorithms at the heart of machine learning and AI are doing. It is a process called “gradient descent” and there are many nice visualizations of how it works. (e.g. https://medium.com/@gallettilance/gradient-descent-a89dbe1affe4) It’s fascinating to see how the algorithm is “putting out feelers” from each optimum it finds in the search for the global optimum, just like I am advising founders to do.
If you haven’t, I bet you’ve at least watched someone struggle with it.
You yank on the starter cord with all your might and…nothing happens. You try it again…still nothing. After a few more tries, you’re sweaty and frustrated. But the grass still needs cutting.
You keep trying.
Three more pulls. Still nothing. You curse and kick the mower.
What’s wrong? Are you not pulling hard enough? Are you not strong enough? Or, is something else wrong?
Next time, you pull the cord and the motor fires. But, just briefly. It quickly stutters out again. Progress of a kind.
Finally, you realize that there’s not enough gas in the tank. Once you top it off, a few more pulls and you’re mowing grass!
This is what starting a company is like. Except slower.
With a startup, each pull of the starter cord is equally tiring. But, each pull can take weeks.
You don’t know how many pulls are going to be needed. You don’t know if it’s ever going to start working.
You just have to keep pulling, and keep tweaking things. Just like the mower, sometimes it will start but then, quickly stop again. It’s just as frustrating but for much longer.
This is why founders need grit to keep pulling. They also need smarts to work out why it’s not working.
But, there’s a better way than struggling alone. What if you had an experienced team to help? A team of lawnmower experts who were there to check there’s enough gas in the tank, to top it off if there isn’t, to make sure the spark plug is not fouled, to make sure the blade is adjusted correctly, or just grab the cord and pull with you.
That’s what a Venture Studio does. A Venture Studio helps you start the lawnmower so you can start mowing.
At Platform Venture Studio, we’re helping the next generation of entrepreneurs start their lawnmowers. If you’ve ever thought about being a startup founder yourself, or just want to checkout the companies we’re building, please consider joining Platform.
This is Part 2 of “Everything You Always Wanted to Know about Unit Economics but were Afraid to Ask”.
This part covers the Unit Economics of Two-sided Marketplaces. If you need an introduction (or refresher) on Unit Economics, please read Part 1 first.
Definition
Firstly, let’s define two-sided marketplaces: these are businesses that make money by connecting Supply with Demand. Examples are Wonolo, Uber, eBay, and Airbnb.
Sometimes, which side is “Supply” versus “Demand” can be counterintuitive. To make it simple, Demand is normally the side that pays the money. The marketplace business collects that money, takes out its slice, and passes the rest of the money to the Supply side.
At Wonolo, our “Supply” is our Wonoloers (the workers who do the job) and our “Demand” is our customers (companies that pay money to have the work done).
For Uber’s core business, riders are the “Demand”, and “Supply” are the drivers and their cars. For Airbnb, “Demand” are guests and “Supply” are hosts with properties.
Unit Economics
Unit Economics get tricky in two-sided marketplaces because you have to consider both Demand and Supply.
To start with, you have two acquisition funnels, two CACs, two LTVs, two Break-even Points, etc. You also have marketplace effects to consider.
This provides for a number of possible approaches to understanding Unit Economics:
model Supply and Demand in isolation,
model the Demand side as your “unit”, and consider Supply-side costs as variable costs,
model your Supply side as your “unit”, and consider Demand-side costs as variable costs, or
combine Supply and Demand and model at the individual interaction level – e.g. your unit is a job (Wonolo), ride (Uber), or stay (Airbnb).
In practice, you will often end up doing all of the above to provide multiple perspectives to investors.
However, for simplicity, my strong recommendation is that you start with modeling your Demand side as your “unit”. I find that this is the most intuitive for most cases. It most closely resembles the modeling of Unit Economics for simpler SaaS businesses, which are what most investors are familiar with.
Extra Layers of Complexity
In addition to considering how to model Supply and Demand, many marketplace businesses have additional complexities which make their Unit Economics even harder to model.
These complexities are not unique to marketplaces but are seen in many of them:
Variable spend: unlike a simple SaaS business, where customers sign-up and pay a fixed amount each month (MRR), marketplace users can have highly variable spend month-to-month. This has large impacts on LTV and break-even, and can make averages misleading.
Variable pricing: often the fee that customers pay is negotiated and/or variable, meaning margin is variable.
Seasonality: if a business is seasonal, it means the Break-even Point depends on when in the year a customer signs-up. This makes it hard to compare cohorts.
Ambiguous churn: for a simple SaaS business, customers sign up and then pay every month until they explicitly cancel their service. In contrast, many marketplaces only make money when supply and demand transact. Either or both sides can go dormant at any time and then come back at any time. This makes modeling churn hard and churn is a big determinant for LTV.
There are various ways to cut through these complexities, including comparing cohorts of like customers, and seasonal adjustments, but I’ll save those for a potential Part 3.
Marketplace Example: Wonolo
Since Wonolo is a business I’m intimately familiar with, I’m going to use it as my example. However, the concepts here will be very similar for any two-sided marketplace.
Note: the numbers I’m using here are for illustrative purposes only, and to make for simple math. Several details that have a smaller impact on the numbers are omitted for simplicity.
Demand-side
Per the above, we’re going to model our Demand-side first.
Demand-side CAC
At Wonolo, our demand side is our customers. A typical customer is a logistics company with a warehouse needing Wonoloers (workers) to work on their production line.
The primary components of our Demand-side CAC are marketing and sales.
For illustrative purposes, let’s say the marketing component is $1,000 and the sales component is $4,000, making a total Demand-side CAC of $5,000. (Remember that these are averages and can vary widely.)
Jobs
Our unit of interaction in our marketplace is the job. e.g. an 8 hour shift in a warehouse.
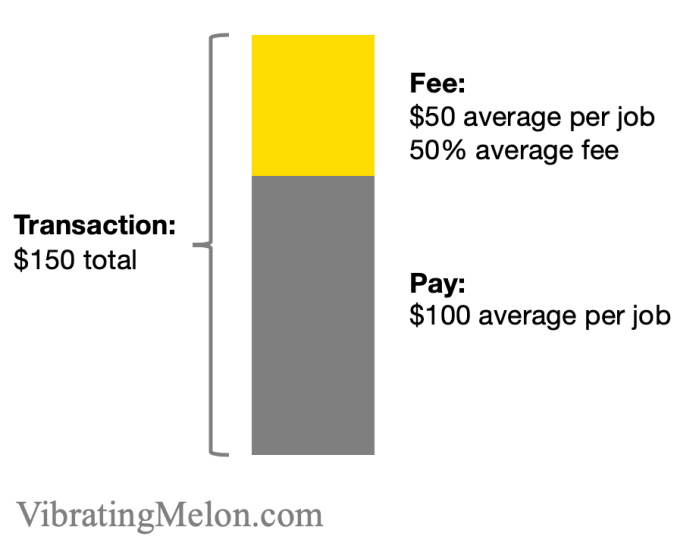
Length of shift and the hourly pay rate vary but, on average, let’s say a shift pays $100 and the average fee to our customer is 50%.
So, for each job, we charge the customer $150. We pass $100 straight on to the Wonoloer who did the job, leaving us with $50.*
Combining this with the CAC above, we can see that it will take the customer using Wonolo for 100 jobs to pay back our Demand-side CAC [$5,000 / $50]. This gives us some sense, but not a full picture, since it doesn’t include the time dimension or the Supply side.
*Staffing companies typically lead with their Gross Revenue, which includes the wages to be paid to the worker. I think this is a misleading “vanity metric” because the wages are simply passed through. At Wonolo, we lead with Net Revenue.
Demand-side Break-even Point
So, we know that it takes 100 jobs to recoup our Demand-side CAC. But, we don’t know how long that takes.
To calculate that, we have to know how frequently our customers use our service – frequency of interaction (also referred to as “frequency of transaction”).
Let’s say that, on average, our customers post 2 jobs (shifts) per day. We therefore now know that we recoup our Demand Side CAC after 50 days usage [100 / 2 = 50].
We also know that we hit our CAC-Doubling Point at twice this – 100 days.
Customer Lifetime & LTV
The next question we need to ask is whether we keep customers for at least 50 days. If we don’t, then we lose them before we pay back our Demand-side CAC, and our Unit Economics are negative.
Good news: we keep an average customer for 500 days. Easily long enough to recoup our Demand-side CAC.
We can also now calculate our Customer Lifetime Value (LTV). 2 shifts per day, at $50 per shift, for 500 days, is an average LTV of $50,000 [2 x $50 x 500].
Supply Side
So far, we haven’t considered the Supply side – in Wonolo’s case, our Wonoloers (workers).
In this approach, we’re going to model the Supply-side costs as Variable Costs incurred in delivering our service to our Demand side (customers).
How much Supply is needed?
The first question to answer is, how much Supply do we need to satisfy our Demand?
In Wonolo’s case – and since the “unit” we’re modeling is our Customer – the question is, how many Wonoloers do we need to do the work one Customer needs done?
The first answer might be to say we need one Wonoloer per shift. However, Wonoloers work multiple times for the same customer, so we don’t need nearly that many.
It turns out that, on average, a Wonoloer works for a given customer 10 times. So we only need 1 Wonoloer for every 10 jobs that our Customer needs done.
Supply-side CAC
Now we need to consider how much it costs us to acquire a Wonoloer.
There are two primary elements here: marketing cost (to get them to download the Wonolo app) and onboarding costs (to get them ready to work).
These costs add up to around $50 to find a Wonoloer and get them ready to do their first job. i.e. our Supply-side CAC is $50.
Impact of Supply-side CAC on Demand Side
Now we know how much Supply we need to satisfy a customer’s demand, and we know how much that Supply costs, we can put it all together.
For convenience, let’s look at a year.
Over the course of a year, a customer will use us for about 730 jobs on average [2 jobs per day for ~365 days].
So, on average, we’ll need 73 Wonoloers to meet that demand [730 / 10], and it’ll cost us $3,650 to acquire them [73 x $50].
Let’s look at how that impacts our overall unit economics calculations.
One approach is to look at the individual job level. It costs $3,650 to get the supply for our customer’s 730 jobs per year. So, per job, it costs us $5 to acquire the needed supply (Wonoloers) [$3,650 / 730 = $5].
Remember that we receive about $50 per job as our fee; so this means we’re spending 10% of that on Supply Acquisition.
So, rather than receiving the full $50 per job to pay back our Demand-side CAC, we’re netting $45 per job. This pushes back our Break-even Point by a corresponding amount. It takes us 111 days to hit breakeven on our $5,000 Demand-side CAC, once we’ve taken account of our Supply side costs [$5,000 / $45 = 111].
Given that we’re viewing the Supply side acquisition costs as variable costs, we can also say that our Contribution Margin of our staffing business is $45 per job and our Contribution Margin Ratio is 1.11 [$50 / ($50 – $5)].
Marketplace Dynamics
So, good news: it looks as if our business has positive unit economics! We break-even on a per customer basis after 111 days on average, even taking into account the cost of finding the needed Supply (Wonoloers).
However, because we’re looking only at one customer in isolation, this entirely misses the fact that Wonolo is a marketplace. These marketplace dynamics actually make the unit economics significantly better. This is one way in which marketplaces can be extremely powerful.
Remember we said that, on average, a Wonoloer works for a given Customer 10 times? That’s true but Wonoloers work at more than one Customer! It turns out that Wonoloers work on average for 10 different Customers during their lifetime on Wonolo.
Therefore, we share our Supply-side acquisition costs across multiple Customers.
This means we can divide the $5 per job that we spend by 10, meaning we only really spend 50 cents on average acquiring the needed Supply for one job [$5 / 10].
This means our Contribution Margin is actually $49.50 per job.
These marketplace dynamics exist in most marketplaces – arguably, that’s the point of the marketplace. Uber drivers don’t just drive one person, eBay sellers don’t just sell to one buyer, Airbnb hosts don’t just have one guest. The ability to “sell” the same Supply to multiple Demand is what makes a marketplace powerful.
Ignored Components
As I said at the outset, I’ve ignored some components of Wonolo’s unit economics that would be included in any full accounting. These would include items such as:
customer account management,
customer and Wonoloer support, and
payment network and banking fees to collect payments from customers and pay Wonoloers.
Negative Unit Economics and The Big Gamble
Everything I’ve described above discusses Unit Economics in a sober and rational way; which is often not the way Silicon Valley works.
There are several high-profile cases where companies have continued to grow aggressively despite clearly having negative unit economics. The poster-child arguably being Uber. At the time of writing (July 2020), despite its huge scale (meaning you’d expect its contribution margins would start to cover its fixed costs), Uber has never made a profit. Will it ever? We’ll see.
To continue to grow despite having negative unit economics, businesses have to continue to raise bigger and bigger gobs of money. Remember: negative unit economics means the more money you spend, the more money you lose. Uber raised a total of $24.5B, including over $9B in their Series G alone.
Investors in Uber are continuing to make a big gamble that there will only be one or two winners, and the winners will be those that capture as much of the market as possible, even if it is done at a massive loss. The thesis is that, once they’ve “won”, they’ll be able to keep out competition and control pricing to the extent that they can become profitable in the long-term.*
Investors are also gambling that Uber will be able to continue to raise money to cover the growing losses. Fortunately for them, their market timing was good and they were able to continue to raise bigger and bigger rounds at higher and higher valuations before IPO. If they were trying to raise that Series G today, it would likely be a very different story.
*This thesis is itself based on a perhaps flawed understanding of the strength of Uber’s network effects, but that’s a topic for another day…
Unit economics are critical to successful business growth. Without positive unit economics, spending more money means you simply lose more money.
However, when it comes to two-sided marketplaces, It’s Complicated™. I’ve seen experienced analysts admit defeat when trying to get to grips with our unit economics at Wonolo.
Here I aim to walk you through the topic step-by-step, in two parts. No prior knowledge is assumed.
Part 1: Unit Economics Basics
I want to provide a gentle learning curve. Before we talk about two-sided marketplaces in Part 2, let’s first quickly cover some basics. If (like me) you don’t have a formal background in finance, you may struggle with some of the terms used.
Disclaimer: because I’m assuming no prior knowledge, some complexities are overlooked for simplicity.
Ok, we’re talking about “unit economics”; so, what’s a unit?
For me, the confusion starts right here. As the name implies, a “unit” might originally have referred to a widget made in a factory. For example, if we run a factory that makes paperclips, unit economics relates to understanding the economics of paperclip production and sales, down to the level of an individual paperclip.
However, in the context of startups, we typically have one product and we’re selling access to that product. The “unit” we’re interested in modeling is the act of selling access to a user or customer.
Therefore, a “unit” is typically equivalent to a customer or user. As we run through these basics, you can think of our “unit” as a customer.
Variable vs Fixed Costs
The first core concept to understand is the distinction between “Variable” and “Fixed” costs.
Simply put:
“Fixed Costs” remain the same, however much you sell.
“Variable Costs” vary depending on how much you sell. If you sell nothing, Variable Costs are zero.
When looking at Unit Economics, we’ll mostly be interested in Variable Costs.
Introducing our Lemonade Stand
I’m going to use a Lemonade Stand as an analogy. It’s a simple but sometimes flawed analogy. (If nothing else, it presents an opportunity for some heart-warming pictures.)
For our lemonade stand:
“Fixed Costs” would be the costs of renting and operating our lemonade stand, and the pay for the person running the stand. They stay the same whether you sell 100 cups of lemonade or 0 cups. (Ok, I wouldn’t normally pay my kids to run a lemonade stand but this is just an analogy.)
“Variable Costs” would be the costs of the lemons, sugar, and water to make the lemonade. They vary with how much lemonade you sell.
Customer Acquisition Cost (“CAC”)
The first of many TLAs (Three Letter Acronyms) is “CAC” or Customer Acquisition Cost. This is what it costs you to acquire one customer.
The most obvious and common costs included in CAC are marketing costs.
There are various accounting practices and standards that determine what else is or isn’t included in CAC. For example, in some cases, CAC may include all or some part of the compensation paid to people directly involved in selling to customers.
[Don’t confuse CAC (Customer Acquisition Cost) with COGS (Cost of Goods Sold) – they are related and may essentially be the same in a simple software business but CAC is the important consideration in our unit economics analysis.]
Our Lemonade Stand
Let’s say we print fliers to advertise our lemonade stand.
These cost $1 each to print and each one brings 10 customers to our stand.
Our Customer Acquisition Cost (CAC) is $0.10 [$1 / 10].
LTV
Our next TLA is “LTV” or Life-Time Value. This refers to how much money you’ll make from each customer, on average, during their entire time being your customer.
LTV is often difficult for startups – especially in the early stages – because you don’t have enough data. For example, perhaps customers will stay on average 2 years or 10 years but, if the startup is only 18 months old, you don’t know yet.
However, as the company ages, you’ll start to see the average customer life-time level off (or “asymptote”) to a certain value.
A complication here is that LTV can either be discussed as “Gross LTV” which is simply the money you get paid by the customer, or “Net LTV” where the variable costs have been subtracted.
Net LTV will typically be much lower than Gross LTV. If you want to look good, use Gross LTV. If you want to really understand your Unit Economics, use Net LTV.
Our Lemonade Stand
We’re going to charge 25 cents for a cup of lemonade. Our stand is only open for 1 month during the summer (and only this year).
On average, each customer buys 4 cups of lemonade. Therefore our customer LTV is $1 [4 x $0.25].
LTV:CAC Ratio
By dividing the average Lifetime Value (LTV) of a customer by the average cost to acquire a customer (CAC), we get the LTV:CAC ratio.
This is a simple measure of the efficiency of our business model – it measures how much more money you get back from each customer versus the cost to get the customer.
Our Lemonade Stand
So, our LTV is $1.00, and our CAC is $0.10, so our LTV:CAC ratio is 10:1. Pretty good.
MRR
Our third TLA is “MRR” or Monthly Recurring Revenue. This is the average amount of money you get each month, from each customer.
MRR is very commonly used for SaaS companies since they tend to have fixed and predictable income from each customer, based on monthly billing of a fixed amount. e.g. $9.99/month, paid every month until you cancel the service.
As we’ll see later, marketplaces can have very different dynamics and MRR can be a much less useful measure. I’m including it here because it is very commonly used in the context of unit economics and provides a simple way to explain some of the following concepts.
Break-even Point
As discussed above, the LTV:CAC ratio provides a simple way to understand the efficiency of a business model by comparing the money you make from each customer against how much money it costs to get them.
However, LTV:CAC ignores the time dimension: in many cases, you bear your CAC upfront but you only receive payment from the customer over time.
The Break-even Point refers to how long it takes a customer to “pay back” what it cost you to acquire them (the CAC).
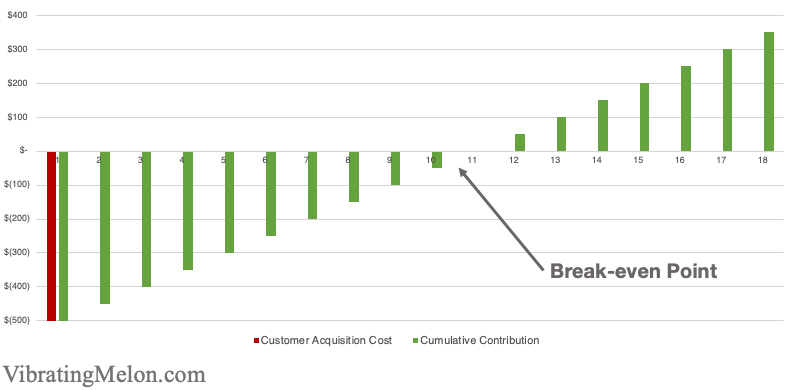
This chart shows a simple example of a company with a $500 upfront CAC and a fixed $50/month MRR. (i.e. a customer costs you $500 to acquire and pays you $50 per month for your services.)
As you can see, it takes 10 months to break-even in this simple case [$500 / $50].
Break-even Point is important because it determines how fast you can grow your business. While you’re waiting for a customer to “pay back” their CAC, you can’t use that same money to do anything else, like acquire more customers. (In finance terms, it impacts your “working capital”.)
So, the shorter your Break-even, the better.
CAC-doubling Time
Once you break-even on a customer, you’ve got your money back, and you can rinse-and-repeat. However, while you’re waiting to get your money back, your speed of growth is limited – you can’t grow any faster without more working capital.
One way to get more working capital is to raise more money from investors. With this money, you can spend it on acquiring more customers while you’re still waiting for your earlier customers to pay back their CAC.
The downside of this from a founder’s point of view is that you have to sell part of your company to raise more money, of course. The downside from an investor’s perspective is that they will have to keep putting more money in to increase the rate that you grow.
Therefore, it’s good to understand the CAC-doubling Point. This is the point in time where you’ve not only recouped the original CAC, but also earned enough to acquire another customer – i.e. 2x the CAC. Once you’ve got 2x your CAC back, you can continue to accelerate your growth without having to raise any more money from investors.
Simply put: your CAC-doubling point tells you how quickly one customer pays you enough to acquire another customer.
Churn
One of the biggest limitations on customer life-time value (LTV) is typically churn – i.e. losing customers.
To understand the impact of churn on your Unit Economics, you need to understand how frequently you lose customers (churn rate) and how much money they’ve spent with you on average before you lose them.
If they churn before paying back what it cost to acquire them (CAC), then you’re going to lose money – your unit economics are negative and the more you spend to acquire customers, the more money you lose.
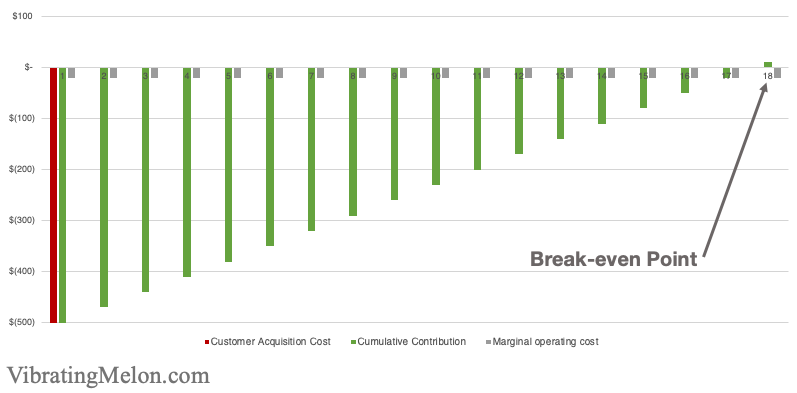
Marginal Operating Costs
Often there are ongoing costs associated with servicing a customer after you’ve paid your CAC to acquire them. Typical examples would be support and service/maintenance costs. Such costs are referred to as “Marginal Operating Costs”.
This is an area where finance conventions can differ but it’s easiest to think of Marginal Operating Costs as Variable Costs that occur over time.
From the perspective of Unit Economics, it’s important to understand the impact of Marginal Operating Costs on your Break-even Point.
The below chart shows the same $500 upfront CAC and $50 MRR but, this time, we’re adding a $20 marginal operating cost each month.
As you can see this pushes back the Break-even Point from 10 months to about 17 months. [$500 / ($50 – $20)]
Contribution Margin
Our final basic Unit Economics term is “Contribution Margin”. This refers to how much of the company’s fixed costs are covered by the revenue from customers, once the variable costs have been taken out.
Personally, I find the term confusing in the context of startups.
“Contribution Margin” is the contribution (hence the name) of a single product towards the company’s overall margin, whereas terms like “Gross Margin” refer to the company as a whole. i.e. if you sell only one product (like most startups), contribution margin and gross margin are essentially equivalent.
Contribution Margin is most often discussed as a ratio – “Contribution Margin Ratio”. It is simply the revenue divided by the revenue minus variable costs. Again, if you have one product only, “Contribution Margin Ratio” is equivalent to the % margin for the business as a whole.
Going Beyond Unit Economics
The ultimate objective is that, over time, your Contribution Margin (or margins, if you have more than one product) will be enough to cover all of your Fixed Costs.
At this point, you can think of your business as “profitable” as a whole, in colloquial terms – enough money is coming in to cover all of your costs (variable and fixed). In accounting terms, we’d also need to consider any costs related to taxes, interest on loans, etc before we can call it truly “profitable”.
Scooter unit economics: a Cautionary Tale
Now let’s take a look at a cautionary example in recent history.
In 2018, rental scooters suddenly appeared on our streets. Bird, for example, raised a $100M Series B and a $300M Series C – both in 2018.
So, scooter rental must be a great business, with great unit economics, right?
Let’s look at the unit economics of scooters:
Acquiring customers was not hard – people were literally tripping over them on the sidewalk (and complaining about it). So, for the purposes of this analysis, let’s say rider CAC was essentially $0.
It cost about $500 to buy one of those first-generation scooters.
Each scooter made about $500 per month in revenue.
The Marginal Operating Costs – charging, relocating scooters, etc – were about $200 per month.
So a Contribution of Margin of about $300 per month, per scooter. You can pay back that $500 purchase cost in less than 2 months. Pretty good business?
You may remember what happened: people didn’t treat the scooters kindly. The average scooter lasted about 28 days, so it wasn’t possible to recover the $500 upfront purchase cost before the scooter was destroyed, and the unit economics didn’t work.
The other thing that happened was injuries and subsequent lawsuits. A big proportion of scooter injuries were nasty head injuries, meaning big payouts for the scooter companies.
The huge amount of investment the scooter companies garnered was enough to maintain these losses for a while but ultimately a few things happened:
Scooter companies tried to source more resilient scooters, with higher longevity to get to breakeven on each scooter (compare how solid current [2020] scooters are with the first-generation 2017 Bird scooter).
Uber/Lyft acquired scooter companies – although the unit economics of scooters were poor, they provided a great way for ride sharing companies to acquire riders, and more cheaply. By becoming scooter chargers, it also allowed Uber and Lyft to offer additional income generation for their drivers.
Some scooter companies pivoted to electric bikes – much lower injury rate, much higher longevity, and much better unit economics.
The lesson of this story is that initial, quick takes on businesses can be misleading – you need to truly understand the unit economics.
Recently, I’ve been hearing about more and more companies building “Product Operations” functions. This appears to be especially true of startups with high operational-complexity; particularly marketplaces.
So, what is Product Operations? Do you need it? Or, is it just another fad?
I spoke with several founders/leaders at a number of high-growth and operationally complex startups who have invested in Product Operations functions, including Uber, Thumbtack, and Zipline.
So, what is it?
The definition of “Product Operations” varies somewhat between companies but here are the main themes I hear:
can be part of the Product organization, but distinct from Product Managers
can also report into the Operations organization
works very closely with operational teams
very detail-oriented and data-driven, especially as it relates to process optimization
provides the bridge between the operations teams and Product Managers, solving problems and being supportive, and ensuring communication is effective
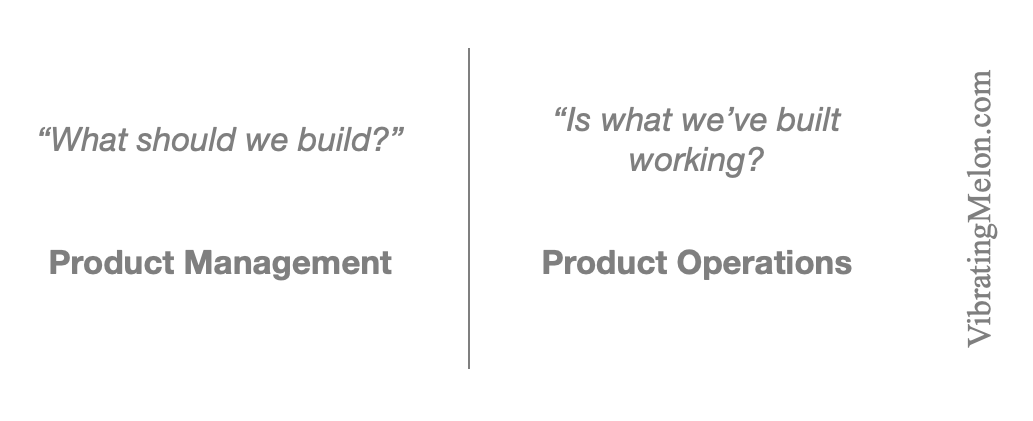
The simplistic distinction between Product Management and Product Operations seems to be as follows:
Product Management – “what should we build?”
Product Operations – “is what we’ve built working?”
So, is it a fad?
This is where my own cynicism started and where I got the first whiff of a possible fad.
To me, being very close to customers, even if internal customers, and having a great finger on the pulse of whether what you’ve built is working is a major aspect of any Product Manager’s job. If a Product Manager is not doing that, they’re not a good Product Manager, right?
Pragmatism Rules
Everyone I spoke to agrees with me…in theory.
However, the reality is that it’s very hard to find Product Managers who have a natural affinity for what’s involved in operating a complex business “at the coal face”. This makes sense because most Product Managers come up through the ranks of product and engineering organizations.
Although a Product Manager’s job is to understand and empathize with users, it seems it can be more pragmatic to hire people with an operational background who just more naturally “get it” and put them in a Product Operations role as the go between operation users and the product team.
Put simply, one person I spoke to said that Product Operations “makes sure operations are getting respected” by the Product organization.
What to look for
So, who makes a great Product Operations person? Here’s a summary of what I’ve heard:
have an operational background (vs a product/engineering background)
adaptive
empathetic
data-driven
strong personalities willing to fight for what they think operations needs
Side effects
Are there any undesirable side-effects of introducing a Product Operations function? The consensus seems to be that two problems can occur:
there is some duplication of effort/ownership between the Product Management and Product Operations and therefore some potential ambiguity and politics that needs to be carefully managed. To mitigate this, the distinction between the two functions summarized above must be made very clear to both sides.
the introduction of Product Operations risks Product Managers retreating further to their ivory towers, allowing them to get more divorced from the (internal) customers they serve.
There are many things that make building and scaling marketplace businesses hard: for example, there’s the quintessential chicken-and-egg problem of building and balancing supply and demand, and there’s the need to build two or more products in parallel to serve the needs of the different participants in your marketplace.
There is also the question of how you scale your marketplace once you’ve got product-market fit established and some unit economics that seem to work.
Electrons vs Atoms
Most marketplaces have to deal with the tangible, real world: unlike pure software/SaaS companies, marketplaces have to deal with whole atoms, rather than just electrons.
Those atoms might make up people, or cars, or meals, or apartments but they are physical resources that have to be managed. This is why marketplaces tend to need significant operational headcount.
However, most marketplace companies aspire to be, and actively position themselves as, technology platform companies. This of course requires an ongoing investment in product/engineering.
Given finite resources, how do you choose between scaling a market place through operation headcount versus product/engineering investment? How do you strike the right balance?
The Comparables
I did some quick research to look at what other marketplace businesses are doing.
I took a basket of marketplace companies at varying funding stages and looked at their employee counts on LinkedIn by role.
Firstly, let’s set the scene by looking at the absolute number of engineers that various marketplaces have and compare that to their funding stage:
Perhaps no surprises here: as marketplaces develop, they hire more engineers. I am struck, though, by the widely varying number of engineers that the earlier stages marketplaces seem to have.
Now let’s look at the ratio between operational headcount and engineering headcount in these same companies:
This is also what you might expect. Although the data is noisy*, it seems that as marketplaces grow, they become less dependent on operational headcount. Presumably, their investments in product/engineering payoff in terms of automations and efficiencies.
Of course there’s also survivorship bias here – these are only the marketplaces that are still around. Perhaps the ones that didn’t make it had wildly different ratios.
What would be great is to get historical data on these ratios and see how that correlates with outcomes. Unfortunately, I don’t have that data (if you do, let me know!).
My bet would be that a higher ratio of operational to engineering headcount is hard for marketplaces to wean themselves off – i.e. it’s hard to change the ratio over time. If you organization gets accustomed to scaling and solving problems by hiring ops people rather than hiring engineers to automate, that just gets amplified over time.
* my methodology here was simply to search on LinkedIn for people with “engineer” and people with “operations” in their job title. This is obviously error prone for a number of reasons. For example, some “engineering” roles have “operations” in their job titles, and not all headcount are necessarily on LinkedIn, especially if a company outsources or off-shores some functions. However, given a sufficiently large sample set, one would hope that these effects blend out.
Brute Force Growth vs Long-term Value
Like any business, marketplaces have to continue to show top-line revenue growth in order to maintain the faith of investors and employees and be able to continue to raise money. The first, second, and third rules of business are “don’t run out of money“.
However, while it’s possible to “brute force” growth of many marketplaces through reliance on operational headcount in the short to medium-term, I believe this strategy has large associated dangers in the longer term.
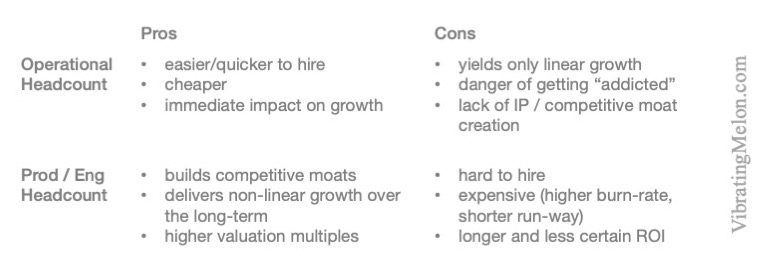
In a perfect world, you could scale both operational and product/engineering headcount as needed but, in reality, you will be forced to choose between spending each $1 on one or the other. Here’s my quick take on the pros and cons:
In summary, the biggest danger with scaling by adding operational headcount is that it works…in the short-term. It’s also cheaper. But, the danger is that you win the battle but not the war.
In a startup, there are always many things that aren’t working as efficiently as they could be – acquisition funnel conversion, manual processes, customer acquisition costs, etc. This may be incredibly frustrating, especially for the team members who have to deal with it on a day-to-day basis.
It’s very tempting to direct precious money, time, and energy to resolving these frustrations, especially as its your team’s tired faces that you have to look at every day. It’s always tempting to give the squeaky wheel some oil.
However, it’s vital that you remain focused on growth and don’t confuse growth with optimization. Burning lots of time optimizing at the expense of growing is not a recipe for success for early- to mid-stage, venture-backed startups.
Of course, there is some nuance here: if things are so broken that your team starts to leave, you have to address that – no team; no company.
Also, the smart investors (i.e. the ones you want) realize that, if your unit economics fundamentally don’t work, you will simply lose more money as you grow.
However, conversely, it’s unlikely that a Tier 1 investor will invest in the also-ran, #3 player in any category in terms of growth rate and/or absolute revenue, however optimized and healthy the acquisition funnels, gross margins, etc. Investors are in the business of selecting for the biggest return on their capital, not the best run or most efficient business. The biggest return comes from the biggest exit and the biggest exit goes to the category winners.
As a venture-backed startup, the most important thing is to stay as one of the leaders in your category – this is what allows you to maintain team confidence and morale, attract the best talent and investors, and continue to raise money when you need it. Note: there are usually only 1 or 2 “leaders” in any category.
Let’s take two startups: to start with, Company A and Company B are neck-and-neck. Both have a $5M in gross revenue, with a average revenue of $5,000 per customer per year and a customer acquisition cost (CAC) of $2,000. Both have revenue that is doubling each year. Both are mid-stage startups – they’re not yet profitable and don’t expect to be any time soon.
Both companies also know that their CAC is too high and, by some optimizations, the CAC can be reduced significantly. The high CAC drives some members of the team crazy – so many opportunities lost, so many wasted marketing dollars.
So, the CEO of Company A directs the team to work on CAC. Over 6 months, they manage to effect a series of changes process and product changes in their customer-acquisition funnel, through A/B testing, cost reduction, etc. These compound and end up halving the CAC to $1,000 – that’s a huge improvement. Company A’s gross margin has significantly improved.
Meanwhile, the CEO of Company B ignores the CAC for now and instead directs the team to focus on increasing the size of the sales and marketing teams significantly and filling the top of the sales funnel with as many leads as possible.
One year later, Company A’s revenue has doubled again and they’re netting an average of $4,000 per customer per year – 33% more. Not bad.
However, by focusing on growth, one year later, Company B’s revenue has tripled rather than just doubling. They still net an average of $3,000 per customer per year but there are 3 times more customers.
Both Company A and Company B need to raise more money. So does a 3rd player in the category; Company C. Company C is going gang-busters, beating both Company A and Company B on growth rate and total revenue.
You know how this story ends: Company B and Company C are able to raise giant C-rounds from Tier 1 investors at great valuations. Meanwhile, Company A has fallen behind – its unit economics are better than Company B’s but it’s now an also-ran and struggles to raise money. Without that money, it cannot continue to grow and falls further and further behind Company B and Company C. Perhaps it’s acquired by Company C at a fire-sale valuation or perhaps it’s a giant smoking crater.
Of course, this is a contrived story. In reality, you can probably achieve growth and some optimization in parallel. But, the key is not to confuse one with the other.
So, grow and optimize as you go, as long as that optimization doesn’t slow your growth. Don’t optimize hoping that it will deliver meaningful growth.
tl;dr – in a startup, you can’t optimize your way to success – you must out-grow your competitors.
You’re sitting in a quiet meeting when a stranger suddenly bursts into the room, screaming and ranting – what is your immediate reaction?
Your answer might say something about your personality. If your first instinct is to act – perhaps to tackle the person, or run and hide – you’re likely a “doer”. If your first reaction is empathy; to wonder why the person is so upset, you’re probably a “feeler”. Lastly, if your first reaction is purely internal – to consider why the person is so mad – you’re a “thinker”.
This simple personality model – doer, feeler, thinker – is of course just one of many. Like any model, none of us fits perfectly. No one is purely a doer, feeler or thinker (we’d be a weird bunch if we were), but we do tend to have a primary or dominant characteristic. Further, it’s important to be aware of the weaknesses of each of these dominant characteristics.
One of the complimentary comments that several members of the team at Wonolo have said to us over the past 4 years is that they think Yong (CEO), AJ (COO) and yours truly (CTO) are a good exec team because we are all very different.
It’s of course very nice to hear and I think the truth here is that, by compensating for each others’ weaknesses, we achieve more than the sum of our parts.
AJ (COO) is a doer; a man of action. His catchphrase might be “Just Do It”.
Last year, when he heard that the US government recommends people walk 10,000 steps per day, he set himself a goal of doing it every single day. At the time of writing, he’s not missed 1 day in 326 – despite weather, holidays, travel, vacation, etc – not one! It’s hard for me to imagine having the consistency and commitment to achieve this.
Yong is a feeler. We use Slack for internal communication and Yong’s handle is “sobstory” (handles are generally chosen by the team).
I think it’s only right and proper that we have a feeler as a CEO, given that we are in the people business. Yong uses his “sob stories” to motivate and inspire the team and to bring empathy and humanity to our business.
That’s not to say that Yong’s not a thinker and a doer too – as well as being one of the nicest guys I’ve ever met, he’s also one of the hardest working. AJ, too, is one of the smartest people I know. But, again, we’re talking about the the dominant aspect of their personalities.
On the flip side, one weaknesses of “doers” tends to be that their bias to action or impatience can make them act before necessary analysis of all the options is done – doers have a low tolerance for long discussions and theory.
Doers also tend to be highly competitive. AJ’s Slack handle is “bookie” owing to his tendency to bet on anything he thinks he can win.
Being competitive is of course a positive quality in many situations. But, for doers, it can also mean that needing to win the argument is more important than making the right decision, and that achieving the goal can become more important than considering whether the goal in question is actually valuable or important.
As to feelers, their empathy can mean they tend to focus too much on how something feels rather than how it is. It means they struggle with decisions they know are right but which negatively impact people. They can be subject to emotional manipulation by others who know they can exploit the feels.
I myself am a thinker. My Slack handle is “dirtyprofessor” (“knowitall” was another candidate).
As a thinker, one of my weaknesses is that, once I’ve worked out how to do something, I’m less interested in actually doing it. I’m more interested in the theory than the practice; the abstract over the concrete. Learning for the sake of learning is fun for me.
Another weakness is that by being very analytical and data-driven, I can tend to get disconnected from the real-world, human impact.
AJ and Yong, respectively, definitely help counter these weaknesses.
I first met AJ and Yong in the summer of 2014 when they were working on Wonolo inside Coca-Cola. I’d love to say that we immediately saw this complementary set of personal styles and that’s why we decided to join forces but the reality, like many things in startup life, is that we simply Got Lucky.
As I’ve aged and learned, I believe I’ve managed to compensate for the weaknesses of being a “thinker” and become a more rounded person but it’s nice to know that Yong and AJ have my back.
What this experience reminds me of is the importance of recognizing your own weaknesses and not hiring solely in your own image. By hiring people who are different to you, you can compensate for our own weaknesses; your blindside. There are no “right” personality types and no one fits precisely in one bucket but, by having a well-rounded team, you will avoid many pitfalls.
Your product probably breaks a little bit all the time and sometimes breaks big time (hopefully, much more occasionally).
Perhaps your website goes down for 4 hours during your busiest season and you miss $10M in potential revenue. Or, you discover that no payments have been processing for 2 days before anyone noticed.
In these serious to catastrophic cases, you really want to get to the bottom of why the problem occurred, with a view to making sure it never happens again.
That’s where conducting an effective Postmortem becomes vital.
Avoid Blame
The ultimate purpose of the Postmortem is to make sure the problem experienced never occurs again.
In order to do this, a Postmortem involves ferreting out root causes (more on this below). Bringing blame into the Postmortem process itself risks causing defensiveness and “ass-covering”. This defensiveness tends to obscure the true root causes.
This is not to say that blame isn’t important or can be avoided. Perhaps someone needs to be fired. But, keep the “blame” part separate from the Postmortem itself in order to get to the true root causes.
The Postmortem Process
I like to conduct the Postmortem process as a group, with all the stakeholders in a room in front of a whiteboard. It’s important that everyone impacted and/or responsible for the problem is involved and has a voice.
At a high-level, my process for conducting a Postmortem is as follows:
agree and define the impact of the problem to the business – e.g. “we lost $10M in potential revenue”
flush out all the causes of the problem down to their root, as far as possible
agree a set of recommendations aimed at ensuring the problem never occurs again
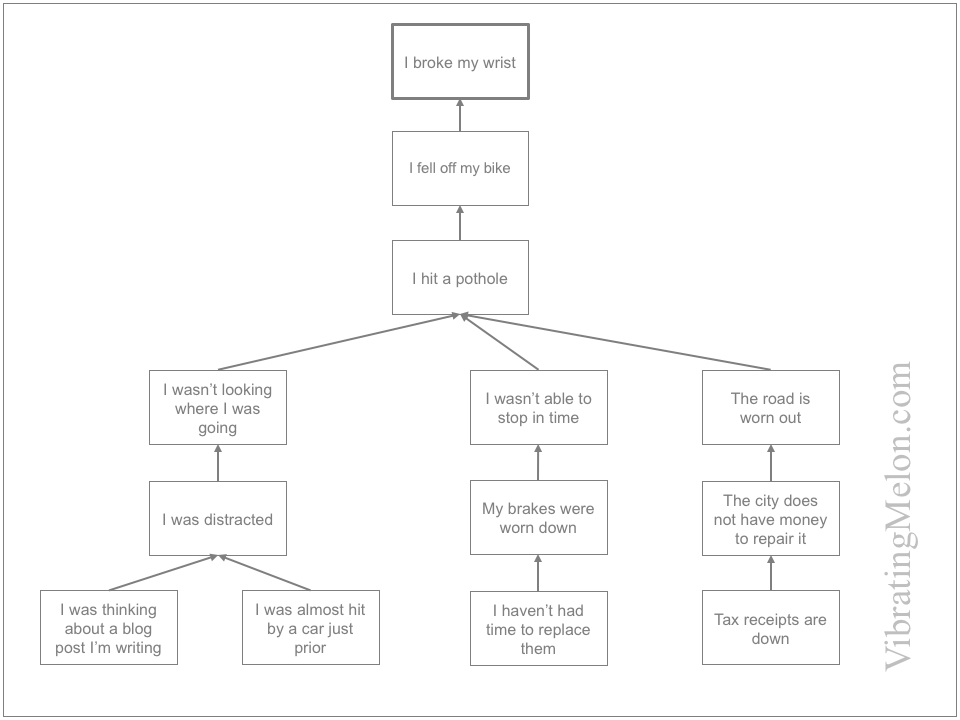
Let’s use a contrived example for illustration. Imagine that I fell off my bike and broke my wrist. We start on the whiteboard with the impact – i.e. I broke my wrist.
Why-Because
My preferred method to analyze causes (step #2 above) is Why-because Analysis.
Why-because is a formalized process but don’t be put off – it can be used more casually with great success and you can add rigor as you become more familiar.
Why-because essentially involves repeatedly asking “Why?” and repeatedly answering with the “because” part. My 5-year old son is also great at this.
e.g. “Why did I fall off my bike?” “…because I hit a pothole.” “Why did you hit a pothole?” “…because I wasn’t looking where I was going.” “Why weren’t you looking where you were going?” “…because I was distracted”
…you get the idea.
Why-because is similar to other processes you may be familiar with like “5 Whys”. (I have found 5 whys to be insufficient because big problems typically have complex causes and the causal chains are often more than 5 levels deep.)
What you end up with at the end of the Why-because Analysis is a graph that shows you all the contributory causes that caused the impact on your business. More formally, when complete, the Why-because graph should include all the necessary and sufficient causes.
Continuing our example, here’s our Why-because analysis of why I broke my wrist:
Of course, you need to decide when you’ve gone deep enough and can stop asking Why? There is no hard-and-fast rule here – just use your judgement – but you don’t want to end up drilling down to “because the big bang happened” in every case.
One great thing about Why-because graphs like the one above is that you can test them to make sure they’re complete:
for each box on the chart, you can ask, had this not occurred, would the problem still have occurred? If the answer is no, it’s a necessary condition.
looking at all the boxes on the chart, you can ask, if all of these happened again, would the problem occur again? If the answer is no, your conditions are not sufficient and you’re not done yet.
Generally, big problems tend to have complex causes. This is because any reasonably mature organization will have checks and balances in place to avoid obvious and predictable failures.
Therefore, you will likely end up with a complex graph that includes a mixture of technical, operational and human contributory factors. It’s particularly important not to overlook or underplay the human factors since fixing the technical and operational issues alone will not avoid the problem recurring.
The most important part of the process is to create a list of recommendations to act on, informed by the detailed understanding of the causes from the Why-because analysis.
Don’t forget the human factors – these are often the most important to address, e.g. additional training, more staff or better process.
Again, you can test your recommendations by saying, if we do all these things, is it highly likely to prevent this problem from recurring again? If the answer is no, you’ve not got the right recommendations.
Lastly, give each recommendation an owner who is responsible for taking action and be sure to follow-up.
If you asked me to choose the 3 most important things that determine success or failure of a startup, I would say:
company culture – it has a profound and pervasive effect and it’s essential to consciously and deliberately nurture it.
focus – doing many things badly rather than a few things well is surefire startup suicide.
cognitive biases– the cognitive weaknesses of the human brain can if, unrecognized, wreak havoc.
I’d argue that luck is an even bigger factor than any of these 3 but, by definition, luck is outside your control.
So, let’s talk about #3 – Cognitive Biases…
Definition
“A systematic pattern of deviation from rationality in judgment and decision making.”
Despite what you might like to think, your brain is not a rational, logical computer – you’re a human being. Your human brain has limitations. It has bugs.
Cognitive Biases have been experimentally proven (again and again) to exist.
So What?
Cognitive Biases are potentially dangerous to all people and organizations but I think are particularly deadly to startups because:
Startups involve making a series of low-data, high-risk decisions. With limited data, Cognitive Biases have a stronger sway.
People working on startups are often stressed and working long hours, making them more susceptible.
The room for error is often very small because of limited funding runway.
Startups are commonly started and staffed by younger people who have less prior knowledge to counteract the impact of Cognitive Biases.
I believe that understanding and being aware of Cognitive Biases leads to better decision making and that better decision making, on balance, leads to better outcomes.
So, let’s look at 12 Cognitive Biases that I have seen are particularly prevalent and particularly dangerous to startups, and how you might spot them and counter them:
1. Correlation vs Causation
Did you know that sleeping with your shoes on is strongly correlated with waking up with a headache?…
…therefore, sleeping with your shoes on causes headaches!
Of course it doesn’t; this is a classic example of confusing correlation with causation.
For some more amusing examples, Tyler Vigen created a great series of charts over at tylervigen.com. Here’s just one for illustration:
In my experience, confusion between correlation and causation is rife in startups.
Partly it’s the limited availability of data…but I’ve also seen that more data can actually make the problem worse. With so many metrics tools available, people tend to get lost in the data and miss the bigger context.
Startups run at high speed and many things are changing in parallel, with little ability to control variables. For example, on several occasions I’ve worked to optimize conversion in a product funnel and been happy to see that the optimization worked, only to discover later that conversion improved due to an unrelated change elsewhere – e.g. positive media coverage.
Remember to always ask yourself, does A really cause B? Always consider that, perhaps:
B causes A
both A and B are caused by C
A and B effect each other
it’s a coincidence
2. Confirmation Bias
Confirmation Bias is the tendency to search for, interpret, favor and recall information in a way that confirms one’s pre-existing beliefs or hypotheses.
More commonly, you might call it “cherry picking”.
I think that Confirmation Bias is a particular problem for startups because they generally have a lot invested in a particular view of how the world should be (or will be) but have very little solid data to go on, especially at an early stage.
Life at a startup is ambiguous; startups struggle and go through hard-times. Therefore, belief is often what carries a team through the tough times.
Startup founders tend to be “true believers”, with a tendency to get high on their own supply. One aspect of Confirmation Bias is that it can maintain or strengthen beliefs in the face of contrary evidence.
Always ask yourself whether you’re truly open to evidence that contradicts your existing views and beliefs. Startups regularly pivot but often pivot too late.
3. Overconfidence & the Planning Fallacy
“the most pervasive and potentially catastrophic of all the cognitive biases to which human beings fall victim” – Svenson (1981)
Sydney Opera House:
Planned Completion Date: 1963, Planned Cost: $7M
Actual Completion Date: 1973, Actual Cost: $102M
Unfortunately, your confidence in your judgments is reliably greater than the accuracy of those judgments. You are overconfident.
The real kicker is that this is especially true when your confidence is relatively high.
Read that again: you’re probably wrong and the more confident you are that you’re right, the more likely you are to be wrong.
One particular aspect of Overconfidence is what is referred to as the “Planning Fallacy” – most people who are involved in software development are probably familiar with it. The Planning Fallacy is the primary reason that software development projects are almost always late.
The Planning Fallacy is the tendency for people to be overly optimistic in how much time will be needed to achieve a task. Counterintuitively, experience doesn’t seem to eliminate the problem – i.e. knowing that similar tasks have taken longer than expected doesn’t solve the problem.
The good news is that the bias behind the Planning Fallacy can be mitigated with a couple of relatively simple “hacks”:
ask someone else – overconfidence generally only occurs when people are estimating their own tasks and disappears when people are estimating for others. So, never ask the person who will be performing the work how long it will take – ask someone else. Better still, ask a number of other people.
In software development, a common technique is “Planning Poker” where a group of people provide blind estimates (so they don’t influence each other) of how long a task will take and the median is used.
break tasks into smaller chunks – experiments have shown that the estimation for how long it will take to do a task is generally always less that the sum of the sub-tasks once they are broken out.
4. Group Think
“Yes; we are all different!”
“Group Think” is probably a term that most people are familiar with.
My experience is that, in startups, it’s closely linked to the Confirmation Bias problem. As discussed above, startups are carried forward by true believers (founders) and dissent is often considered heretical.
Perhaps the best way to understand Group Think is to look at what people do that makes it happen:
Minimize conflict – with a few exceptions, most people don’t want to fight. Hey, startups are stressful enough. However, there are sometimes necessary conflicts.
Suppress dissenting viewpoints – startup founders are usually, almost by definition, very strongly opinionated and convincing. The flip side of this is that they tend – consciously or otherwise – to stifle viewpoints that contradict their worldview.
Isolate outside influences – some startups have company cultures that are cult-like. While this may be very useful in getting everyone aligned on an objective, taken too far it is dangerous, leading to “not invented here” syndrome and hubris.
Appeal to authority – startup teams must be encouraged to “speak truth to power” and call out the elephant in the room.
5. The Curse of Knowledge
It’s extremely hard to imagine what it’s like to not know what you know. i.e. you can’t “unknow” something. This is the Curse of Knowledge.
In the context of a startup, one of the biggest problems is trying to put yourself in the shoes of your user or customer. The reality is that you can’t. You’re so deep into the problem that you’re trying to solve that it’s impossible to see it in the same way that an outsider would.
This really underlines the importance of doing User Testing on your product using real users, not internal team members. Watching people unfamiliar with your business and the problem you are trying to solve use your product is always extremely revealing. There are always many implicit assumptions that you’ve made and these are only exposed through contact with real users.
6. Anchoring
Anchoring is the tendency to rely too heavily on the first piece of information you get and a tendency not to adjust your position based on further evidence that contradicts it.
Anchoring is what skillful negotiators – e.g. car salespeople – exploit to get the deal they want. The first price discussed tends to anchor the subsequent negotiation.
In a startup, your first customer deal, your first hire, your first customer loss, etc tend to set a mental template for “how things work” with your business. It’s important to periodically ask yourself if you’ve become anchored in a world view that isn’t necessarily correct.
7. Sunk Cost Fallacy
You might call this “flogging a dead horse” or “throwing good money after bad”.
Sunk Cost Fallacy is a tendency to continue to rationalize decisions and actions when faced with increasingly negative outcomes. A “sunk cost” is a cost that you’ve already paid and can’t get back – money that is already spent whether you continue or not.
Sunk Cost Fallacy is, I think, one of the primary reasons that many startups pivot too late and end up running out of money.
Being rigorously data-driven is probably the best antidote to Sunk Cost Fallacy (and other Cognitive Biases). Set specific metrics that need to be achieved by specific dates in order to assess whether a particular initiative or direction is working and hold yourself and your team to them.
8. Attribution Bias
Attribution Bias is the tendency, when evaluating the causes of the behaviors of a person you dislike, to attribute their positive behaviors to the environment and their negative behaviors to the person’s inherent nature.
We all have to work with people we don’t necessarily like. It’s important to realize that we probably can’t accurately understand others’ internal motivations and try not to take personally the behaviors that we consider negative.
9. Ostrich Effect / “The Elephant in the Room”
The Ostrich Effect is the avoidance of risky/difficult situations by pretending they do not exist.
The “elephant in the room” is an obvious truth that is being ignored or going unaddressed.
It’s critical to build a company culture in which people are encourage to call out the elephant in the room. If you don’t, you will be trampled by the elephant.
10. Hindsight Bias
“I knew it all along!” …actually, you didn’t.
Hindsight Bias is our tendency to see an event, after it has occurred, as having been predictable.
Hindsight Bias is a large and fascinating topic. I can’t possibly do it justice here.
It’s unfortunately one of the hardest to counteract. The only known way is to ask whether or not alternate hypotheses and predictions would have been equally believable ahead of time.
11. Survivorship Bias
Ever had a conversation like this? “Uber did X therefore we should be doing X!”
In reality, it’s likely that there were many other companies that did X but which don’t exist anymore…so you won’t be hearing from them.
Survivorship Bias is concentrating on the people or things that “survived” some process and overlooking those that didn’t because of their lack of visibility.
Survivorship Bias is one of my favorites simply because it is extremely common in Silicon Valley. Beware of people claiming that companies succeeded because of specific reasons without data showing that those reasons were in fact the reasons they succeeded.
12. Bias Blindspot
Lastly, we all tend to think of our own perceptions and judgments as being rational, accurate, and free of bias.
In a sample of more than 600 residents of the United States, more than 85% believed they were less biased than the average American.
This is despite the overwhelming amount of experimental evidence that they are not.
Summary
Firstly, forget any idea that you can eliminate these biases – you can’t. However, you can educate yourself about them, build awareness in your team and encourage people to question themselves and call them out when they see them.
Additionally, the #1 thing you can do to help counteract these biases in your startup is be Data Driven. Data of course does not solve all problems but, by asking the right questions and getting accurate answers, you can cut through many Cognitive Biases.
Lastly, it’s important to note that these Cognitive Biases are subtle and pernicious. Companies do not usually fail because of one Cognitive Bias affecting one decision. Instead, the impact Cognitive Biases have is across a series of decisions over time. Be mindful.
Further Reading
There are a few other Cognitive Biases that didn’t quite make the list but which I still think are hugely relevant and I’ve observed in startups:
illusion of validity – belief that additional information generates additional relevant data for predictions, even when it evidently does not
information bias – the tendency to seek information even when it cannot affect action
zero-risk bias – preference for reducing a small risk to zero over a greater reduction in a larger risk
loss aversion – the tendency to focus more on what you might lose from a particular decision than what you might gain